


Join Our Groups


TOPIC 2: THEORY OF SUPPLY

The Meaning of Supply
Explain the meaning of supply
What Is Supply?
In economics, we have two forces: the producer, who makes things, and the consumer, who buys them. Supply is the producer's willingness and ability to supply a given good at various price points, holding all else constant. An increase in price will increase producer's revenues, so they'll be willing to supply more; a decrease in price will reduce revenues, and so producers will supply less.
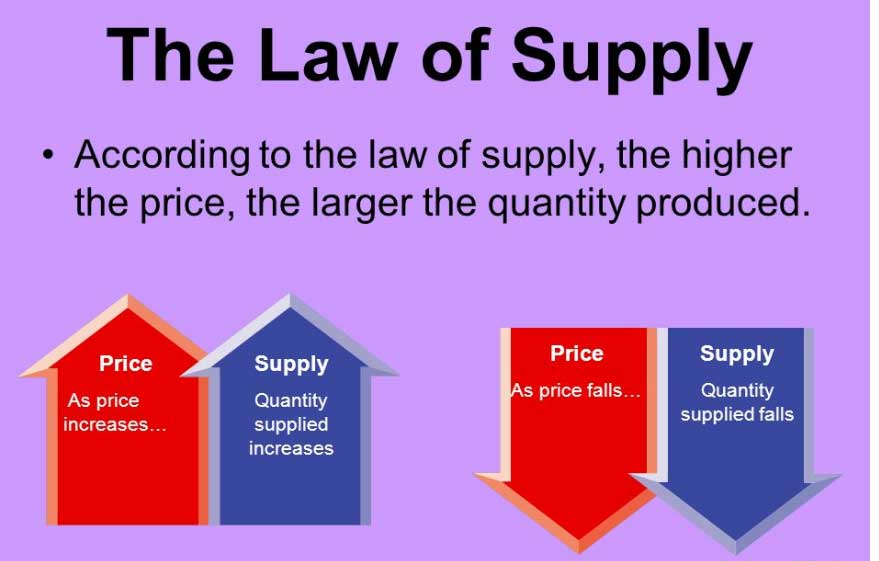
The Law of Supply:
The law of supply states that, ceteribus paribus (Latin for 'assuming all else is held constant'), the quantity supplied for a good rises as the price rises. In other words, the quantity demanded and price is positively related. Supply curves are drawn as 'upward sloping' due to this positive relationship between price and quantity supplied. Note: There are theoretical instances where the law of supply might not hold, though these are rarely, if ever, seen in the real world. Supply’s counterpart is demand; it measures how many consumers will want to buy a product at various price points.
FACTORS INFLUENCING SUPPLY
- Price of the given Commodity: The most important factor determining the supply of a commodity is its price. As a general rule, price of a commodity and its supply are directly related. It means, as price increases, the quantity supplied of the given commodity also rises and vice-versa. It happens because at higher prices, there are greater chances of making profit. It induces the firm to offer more for sale in the market. Supply (S) is a function of price (P) and can be expressed as: S = f (P). The direct relationship between price and supply, known as ‘Law of Supply’. The following determinants are termed as ‘other factors’ or factors other than price’.
- Prices of Other Goods: As resources have alternative uses, the quantity supplied of a commodity depends not only on its price, but also on the prices of other commodities. Increase in the prices of other goods makes them more profitable in comparison to the given commodity. As a result, the firm shifts its limited resources from production of the given commodity to production of other goods. For example, increase in the price of other good (say, wheat) will induce the farmer to use land for cultivation of wheat in place of the given commodity (say, rice).
- Prices of Factors of Production (inputs): When the amount payable to factors of production and cost of inputs increases, the cost of production also increases. This decreases the profitability. As a result, seller reduces the supply of the commodity. On the other hand, decrease in prices of factors of production or inputs, increases the supply due to fall in cost of production and subsequent rise in profit margin. To make ice-cream, firms need various inputs like cream, sugar, machine, labour, etc. When price of one or more of these inputs rises, producing ice-creams will become less profitable and firms supply fewer ice-creams.
- State of Technology: Technological changes influence the supply of a commodity. Advanced and improved technology reduces the cost of production, which raises the profit margin. It induces the seller to increase the supply. However, technological degradation or complex and out-dated technology will increase the cost of production and it will lead to decrease in supply.
- Government Policy (Taxation Policy): Increase in taxes raises the cost of production and, thus, reduces the supply, due to lower profit margin. On the other hand, tax concessions and subsidies increase the supply as they make it more profitable for the firms to supply goods. 6.
- Goals / Objectives of the firm: Generally, supply of a commodity increases only at higher prices as it fulfills the objective of profit maximization. However, with change in trend, some firms are willing to supply more even at those prices, which do not maximise their profits. The objective of such firms is to capture extensive markets and to enhance their status and prestige.
Supply Schedule and Curves
Draw supply schedule and curves
Supply Schedules:
A supply schedule is a table which lists the possible prices for a good and service and the associated quantity supplied. The supply schedule for oranges could look (in part) as follows:
- 75 cents - 470 oranges a week
- 70 cents - 400 oranges a week
- 65 cents - 320 oranges a week
- 60 cents - 200 oranges a week
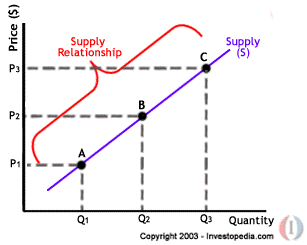
The Supply Curve
The supply curve shows the quantity supplied of a given product at varying price points, holding all else constant. Here's a graph of the supply curve.
You'll notice that the x-axis is labelled 'Q', and the y-axis is labelled 'P.' Those stand for quantityand price. Just like we saw earlier, when the price of a good goes up, the supply does as well. Each producer has his or her own supply curve for a given product, which can vary from one producer to another. The exact curve depends on production costs and other variables.
Let's look at an example. Imagine two wineries in the Paso Robles region: Paso Winery and Robles Winery. Paso Winery may be willing to supply 20 bottles of their wine if the market price were $10 per bottle but willing to supply 100 bottles if the price were $50 per bottle. Robles Winery may only be willing to supply 5 bottles if the price were $20 each and 50 bottles at a price of $50 each.
The summation of the two individual supply curves creates a market supply curve, with red wine ranging from $10 a bottle up to $50 a bottle. The two individual supply curves differ because the wineries are willing and able to supply red wine at different prices. This may be due to varying input costs. Those are the costs associated with producing the wine, such as the variety of grape being used, labour costs, or technique of fermenting the grapes.
The Causes of Supply Changes
Mention the causes of supply changes
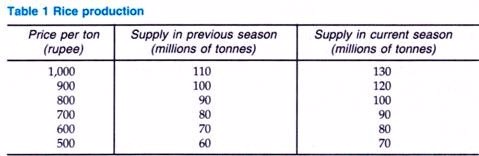
Changes in Supply in Market: Causes and Effects (With Example)
A change in supply occurs when the conditions facing suppliers alter. In such a situation, a different quantity will be offered for sale at each price. For instance, a good period of weather may increase the rice crop in a country. This will make it possible for rice farmers to supply more. Table 1 shows the original supply schedule in the previous season and the supply schedule in the current season.
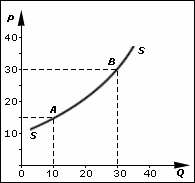
Shifts in the Supply Curve:
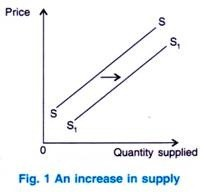
While a change in the price of the product itself causes a movement along the supply curve, a change in supply conditions causes the supply curve to shift. An increase in supply is illustrated by a shift to the right as shown in Fig. 1. At each and every price, more is supplied.
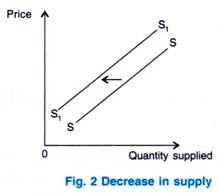
In contrast, a decrease in supply results in a movement of the supply curve to the life, as shown in Fig. 2. Now whatever the price, less will be supplied.
Causes of Changes in Supply:
Among the factors that can cause a change in supply are changes in the costs of production, improvements in technology, taxes, subsidies, weather conditions, health of livestock and crops. It is also affected by the price of other products. Disasters, wars, discoveries of new sources and depletion also contribute to this change of commodities.
Changes in the costs of production:
If it costs more to produce a product, suppliers will want a higher price for it. For example, if it costs $200 to produce four units, firms would supply four units at a price of $50 per unit. If costs rise to $280, they would be prepared to sell only four units, at a price of $70 each.
The two basic reasons for a change in costs of production are:
- A change in the price of any of the factors of production
- A change in their productivity.
If, for example, the price of raw materials used increases, it will be more expensive to produce a product. One cost which changes frequently is the cost of transporting goods. This is because the price of oil used in petrol, is itself very volatile.
A rise in the productivity of a factor of production will reduce unit cost. For example, if a worker who is paid $200 a week produces 100 units, the labour cost per unit is $2. If her or his productivity rises to 200, the labour cost per unit would fall to $1.
An increase in the wages paid to workers by it would raise the costs of production and therefore cause a decrease in supply. It is interesting to note, however, that if it is accompanied by an equal rise in productivity, then unit costs and supply will remain unchanged.
Improvements in technology:
This influence is closely related to the previous one, since improvements in technology raise the productivity of capital, reduce costs of production and result in an increase in supply. It has become much cheaper to produce a range of products due to the availability of more efficient capital goods and methods of production.
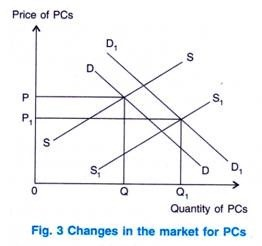
For instance, whilst world demand for personal computers has increased in recent years, the supply has increased even more as it has become easier and cheaper to produce them. Fig. 3 shows these changes and the resulting fall in price.
Taxes:
Taxes on firms, including corporation tax and indirect taxes such as VAT and excise duty, are effectively a cost that firms have to pay. They are likely to try to recoup at least some of this extra cost by raising the price paid by the consumers.
Nevertheless, the firms themselves are largely responsible for passing on the tax revenue to the government. A rise in the rate of an existing tax or the imposition of a new tax will make it more expensive to supply a product and hence will reduce supply. In contrast, a cut in a tax or its removal will increase supply.
Subsidies:
A subsidy given to the producers provides a financial incentive for them to supply more. Besides being paid by the consumer, they are now being paid by the government also. As a result, the granting of a subsidy will cause an increase in supply whilst the removal of a subsidy will cause a decrease in supply.
Most countries, throughout the world, subsidies some agricultural products. A number of them also give subsidies to new and important industries. Less frequently, a government may also give a subsidy to consumers, to encourage them to buy a particular product. For example, grants may be given to households to enable them to buy houses. In this case, of course, it is demand and not supplies conditions which change.
Weather conditions and health of livestock and crops:
Changes in weather conditions affect particular agricultural products. A period of good weather around harvest time is likely to increase the supply of a number of crops. Very dry, very wet or very windy weather, however, is likely to damage a range of crops and thereby reduce their supply.
The amount of agricultural products produced and available for supply is also influenced by the health of livestock and crops. The outbreak of a disease, such as foot and mouth in cattle or blight in crops, will reduce supply.
Prices of other products:
Firms often produce a range of products. If one product becomes more popular, its price will rise and supply will extend. In order to produce more of this product, the firm may divert the resources from the production of other products.
The prices of these other products have not changed but the firm will now supply less at each and every price. For example, if a farmer keeps cattle and sheep, a rise in the price and profitability of lamb is likely to result in the farmer keeping fewer cows and a corresponding decrease in the supply of beef.
Besides the products being supplied in a competitive environment, they can also be jointly supplied. This means that one product is automatically made when another product is produced i.e. one product is a by-product of the other one. For example, when more beef is produced, more hides will be available to be turned into leather.
In the case of products which are jointly supplied, a rise in the price of one product will cause an extension in supply of the other product. Firms make more of one product because its price has risen. The supply of the other product will increase automatically. More is produced, not because it has risen in price but because the price of a related product has risen.
Disasters and wars:
Natural disasters, such as hurricanes, floods and wars, can result in a significant decrease in supply. The Tsunami, for instance, that hit Sri Lanka and other South Asian countries in December 2004 destroyed hotels, damaged beaches and killed the staff working in hotels. As a result, the supply of hotel accommodation decreased.
Discoveries and depletions of commodities:
The supply of some commodities, such as coal, gold and oil, is affected by discoveries of new sources. For instance, the discovery of new oilfields will increase the supply of oil. In contrast, if coal mines are expended, the supply of coal will be reduced in the future.
The Effect of Changes in Supply:
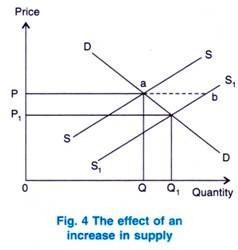
Changes in supply cause a change in price and a movement along the demand curve. Initially, an increase in supply will cause a surplus. This surplus will drive down the price and result in an extension in demand, as shown in Fig. 4.
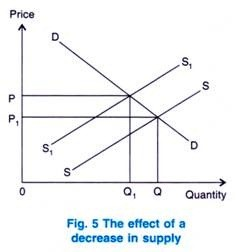
A decrease in supply will have the opposite effect. It will cause a rise in price, which in turn causes a contraction in demand, as shown in Fig. 5
Elasticity of Supply
Calculate elasticity of supply
Price elasticity of supply (PES) measures the responsiveness of quantity supplied to a change in price. It is necessary for a firm to know how quickly, and effectively, it can respond to changing market conditions, especially to price changes. The following equation can be used to calculate PES
Elasticity of Supply = (% change in quantity supplied) / (% change in price).
While the coefficient for PES is positive in value, it may range from 0, perfectly inelastic, to infinite, perfectly elastic.
Consider the following example:
Let's look at an example. Assume when pizza prices rise 40%, the quantity of pizzas supplied rises by 26%. Using the formula above, we can calculate the elasticity of supply.
Elasticity of Supply = (26%) / (40%) = 0.65.
Example 1
Example
Calculate the price elasticity of supply using the mid-point formula when the price changes from $5 to $6 and the quantity supplied changes from 20 units per supplier per week to 30 units per supplier per week.
Solution
- Percentage change in quantity supplied = (30 − 20) ÷ {(30 + 20) ÷ 2} = 40%
- Percentage change in price = ($6 − $5) ÷ {($6 + $5) ÷ 2} ≈ 18%
- Price elasticity of supply ≈ 40% ÷ 18% = 2.22
A firm’s market price increases from £1 to £1.10, and its supply increases from 10m to 12.5m. PES is:
+25 +10 = (+) 2.5
The positive sign reflects the fact that higher prices will act an incentive to supply more. Because the coefficient is greater than one, PES is elastic and the firm is responsive to changes in price. This will give it a competitive advantage over its rivals.
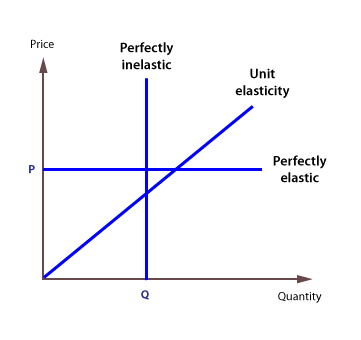
Extreme cases
There are three extreme cases of PES.
- Perfectly elastic, where supply is infinite at any one price.
- <!--[endif]-->Perfectly inelastic, where only one quantity can be supplied.
- <!--[endif]-->Unit elasticity, which graphically is shown as a linear supply curve coming from the origin.
Determinants of PES
How firms respond to changes in market conditions, especially price, is an important consideration for the firm itself, and to an understanding of how markets work.
The key considerations are:
- Are resource inputs readily available?
- Are factors mobile - are workers prepared to move to where they are needed?
- Can finished products be easily stored, and are there existing stocks?
- Is production running at full capacity?
- How long and complex is the production cycle or production process?
What is the most desirable PES for a firm?
It is desirable for a firm to be highly responsive to changes in price and other market conditions. This is because a high PES makes the firm more competitive than its rivals and it allows the firm to generate more revenue and profits.
Improving PES
Because a high PES is desirable, it may be necessary for firms to undertake actions that improve their speed of response to changes in market conditions. Examples of these actions include:
- 6. Creating spare capacity
- 7. Using the latest technology
- 8. Keeping sufficient stocks
- 9. Developing better storage systems
- 10. Prolonging the shelf life of products
- 11. Developing better distribution systems
- 12. Providing training for workers
- 13. Having flexible workers who can do a range of jobs
- 14. Locating production near to the market
- 15. Allowing inward migration of labour if there is a labour shortage.
Exercise 1
QUIZ
- Explain the factor influence change in supply of commodity
- State the law of supply


EmoticonEmoticon