


Join Our Groups


TOPIC 5
MAP WORK
Various definitions of Map
- A map is a symbolic representation of selected characteristics of a place, usually drawn on a flat surface.
- A map is a drawing of a particular area such as a city, a country, or a continent, showing its main features as they would appear if you looked at them from above.
- A map is a visual representation of an entire area or a part of an area, typically represented on a flat surface.
- A map is a symbolic depiction emphasizing relationships between elements of some space, such as objects, regions, or themes.
- Map is a representation of an area of the earth’s surface on a flat surface such as paper, wood, board, card, plastic, cloth or some other material.
Map reading is the process of examining the given topographical map, conventional symbols and signs
Map interpretation is the process of examining a given topographical map of an area represented for the purpose of identifying the geographical information of an area.
Map Work is the study and analysis of maps, especially prior to, or in relation to fieldwork
The work of a map is to illustrate specific and detailed features of a particular area, most frequently used to illustrate geography. Maps attempt to represent various things, like political boundaries, physical features, roads, topography, population, climates, natural resources and economic activities.
Cartography is the study and practice of making maps.
Cartographer a person who draws or produces maps.
 |
| Map of Tanzania |
TYPES OF MAPS
The classification of maps is based on the purpose for which each map is drawn. Therefore map can be categorized into three types as follows:
1. Sketch map
2. Atlas map/ wall maps
3. Topographical maps
1. Sketch Maps; A map drawn from observation (rather than from exact measurements) and representing the main features of an area.
2. Atlas Map / wall map; A collection of different maps that have been bound together in one volume to form a book. These maps are usually drawn to scales example shows town and cities, hills, mountains, valleys, forests, countries, etc.
3. Topographical Maps; Shows selected physical and human features in an area and their positions on the ground for example hills, village, mountains, lakes, ponds, rivers
 |
| Topographical Map |
COMPONENTS / ESSENTIALS OF A GOOD MAP
A map is good if it contains all the essentials of maps, therefore the essentials are good qualities of maps. The essentials of a good map are:
1. Key. This is a list of symbols and signs with their meanings as used in the map. It appears in a box at one of the bottom comers of the map. When these symbols and signs are given in the key, it becomes easier to interpret a map and get accurate information from it.
2. Title; This shows the topic or subject matter of the map. It gives the name of the area which the map represents or the features represented on that map. The name of the map enables the user to read and interpret the map easily.
2. Title; This shows the topic or subject matter of the map. It gives the name of the area which the map represents or the features represented on that map. The name of the map enables the user to read and interpret the map easily.
3. North direction; This is an indication of the north direction. It shows where north is and by knowing north one can know the direction and bearing of the place.
4. Margin; This is a boundary or limit around the map. It gives or shows the reader and interpreter the end of the map.
5. Scale; It shows the relationship between map distance and the actual ground distance for example 1cm to 10km means one centimeter on the map represents ten kilometers on the ground
6. Latitude and Longitude / Grid Reference. It used to locate the place on the map. For example the map of Tanzania is located at latitude 6°00' south of the equator and longitude 35°00' east of Greenwich meridian.
6. Publisher and date publication; This shows when the map was produced and a publisher.
MAP SCALE
Is the relationship or ratio between map distance and actual ground distance.
Scale = Map distance / Ground (actual) distance.
Types of Scale
We can classify the scale according to the size in our criteria. There are three types of scales;
a) Large Scale
They are used to present information on small areas for example a map of village buildings and farms. The map size involves all numbers less than 1:25000 i.e. 1:10000 and 1:5000
Characteristics of large scale.
1. It has smaller numbers in the denominator.
2. It shows features clearly
3. It contains geographical details.
b) Medium Scale
They are used to represent medium details shown on the map. i.e. 1:50,000 and 1:100,000. Example of a map that can be drawn using medium scale is a map of a district, region, city etc.
c) Small Scale
They are used to present information that is long. This type of scale covers a big area with less detail. For example a map of a country, continent or world. May involve numbers between 1 : 500,000 to 1 :1000,000
Characteristics of small scale
1. It has the largest denominator.
2. Contains a lot of geographical information.
3. It does not show geographical features clearly.
Ways Used to Express Map Scale
1. Statement Scale.
Refers to the scale which is expressed in terms of words or explanation. For example one centimeter on a map is equivalent to 10 centimeters on the ground.
2. Linear Scale
Also is called plain or graphic scale. This is a line which is divided into two parts. The primary division and secondary division. The secondary are expressed in meters and placed on the left side from zero and primaries are expressed in kilometers and placed on the right side from zero.
3. Representative Fraction (RF) Scale
Is written as a fraction or ratio eg. 1:50,000 50,000 The distance on a map is expressed as fraction of the actual distance on the ground. Therefore, RF scale = map distance Ground distance. The top number (numerator) represents the map distance on the ground and is usually more than
Scale Conversion
a) 1:50,000 convert into statement scale
Soln
1 KM = 100,000 CM
Take the denominator (50,0000) devide by 100,000 (actual number in a km) 50,000 / 100,000 = 0.5 KM
Thus, One centimeter to half kilometer (1cm to 0.5km)
b) To change statement to R.F scale.
1cm represents 60km
Soln
1km=100000cm
60km= x 1:6000000
Therefore R.F scale = 1:6000000
Importance of Scale on the Map
1. Scale help to calculate area of a map
2. It enable us to calculate distance on a map
3. Scale shows the relationship between map distance and the actual ground distance 4. Scale help us to enlarge and reduce the area on a map or the whole map
5. Scale can be used to calculate the vertical exaggeration on a map
6. Scale is used to calculate the gradient on a map
Measurement of Distances on Maps
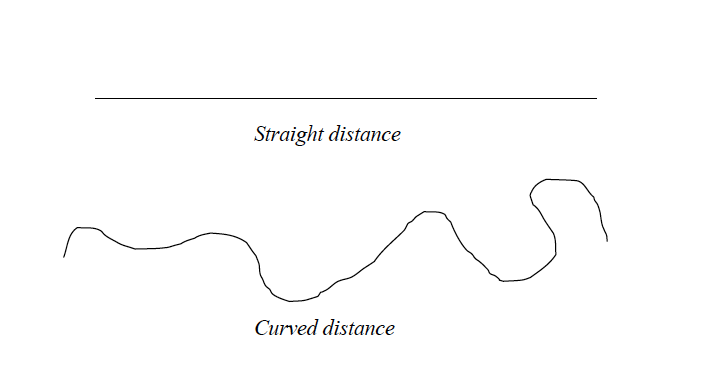
Distance is the length of elongated features on the earth’s surface such as road, railway, river etc. How to measure distance. In order to obtain distance of any feature on the map, consideration should be made on whether the distance to be measured is straight or curved. Straight distance For all straight distances a ruler is used to obtain the distance directly from the topographical map given. Curved distance. It becomes difficult to obtain curved distance of the features by the use of a ruler directly from the topographical map when the area is inclined.
Distances on maps can either be straight or curved (bent). A straight or regular distance is one that has no bends or curves while a curved (or irregular) distance is the one with bends or curves.
Distances on maps can either be straight or curved (bent). A straight or regular distance is one that has no bends or curves while a curved (or irregular) distance is the one with bends or curves.
Tools for measuring distances
There are three main tools that are used for measuring distances on maps. These are:
- a long, thin string or thread;
- a piece of paper; and
- a pair of dividers.
Measurement of distance using a thread or string
A long, thin string such as sewing thread can be used to measure a stretch of many curves or bends. This is the commonest method used by geography students to estimate distances on maps. This method is also used to estimate straight distances.
Procedures
- Identify the distance to be measured on the map (e.g. a river, road, railway line, etc) and mark its two ends with a sharp pencil. Mark one end as A and the other as B.
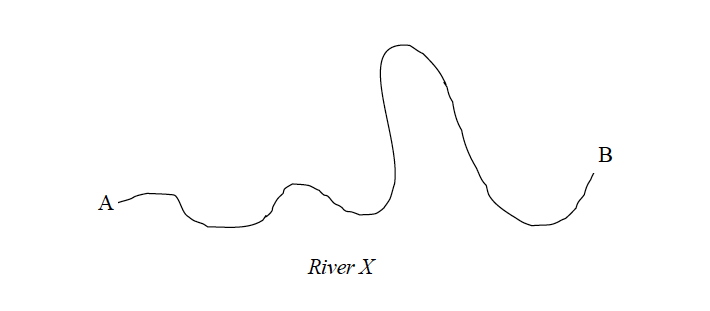
- Starting from one end of the string, trace the route (river, road, etc) with a string as shown in the figure below:
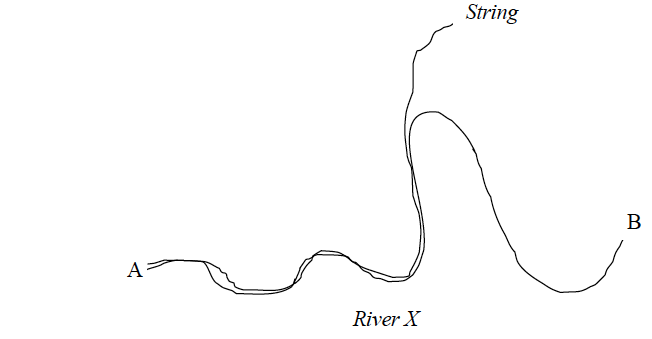
- Mark the string with an ink at point B.
- Using a ruler or linear scale, measure the length of the string between point A and B and estimate the actual distance on the ground using the scale of the map provided.
Example 2
If the length of the section of the string between A and B is 20 cm and the scale of the map is one centimetre to one kilometre, then the length of the route on the ground is 20 km.
Measurement of distances using a piece of paper
A piece of paper can also be used to measure straight and irregular (curved, bent) distances
Measuring straight distances
Procedures
- Locate the distance to be measured on the map and mark its two ends as A and B using a sharp pencil.
- Take a piece of paper, fold it to form a straight edge and lay the edge along the line AB and mark the exact length of the line on the edge of the paper as shown in the figure below.
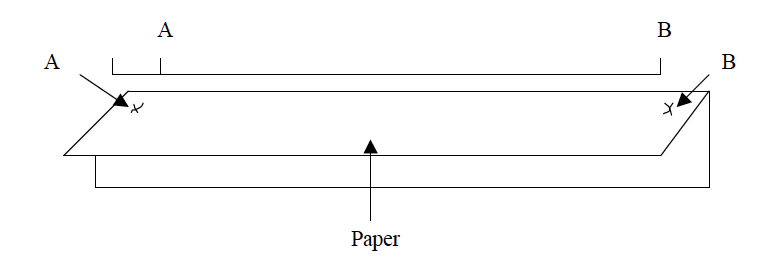
- Transfer the paper to a linear scale (or ruler) as indicated in the figure below so that the left hand mark (A) is on 0 (zero).
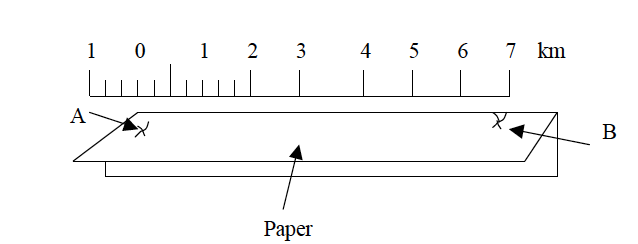
- Use the provided scale to estimate the actual ground distance.
Measuring irregular (curved) distances
Procedures
- Identify the length to be measured on the map. Use a sharp pencil to mark both ends A and B.
- Divide the route into sections which are more or less straight as shown in the figure below.
- Lay the straight edge of the paper on the first straight section of the route. Mark with your pencil where the route bends (point 1).
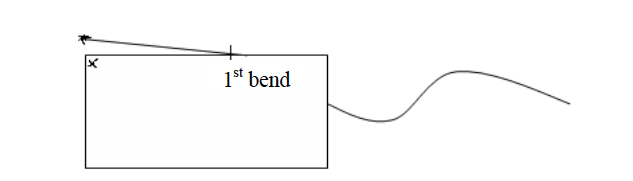
- Turn the paper so that the edge now lies along the second part of the route. Make sure that the mark you made is still on the point where the route bends. Now make another mark with your pencil at the bend (point 2).
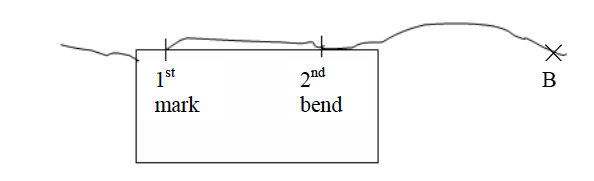
- Continue shifting the paper and marking the other distances between the points on the route.
- Remove the marked paper, and using a ruler, measure from where you started to the last mark on the paper. If this distance is 20 cm and the scale is 1 cm to 1 km, then the distance of the route between A and B is 20 km.
Measuring distances using a pair of dividers
Measuring straight distances procedures
- Locate the distance to be measured on the map and mark its two ends using a pencil.
- Use a pair of dividers to measure the distance between the two end points on the map.
- If the distance is longer than the length of the dividers even when fully stretched measure the distance in sections and then sum up the lengths of all sections to get the total length.
- Place the divider on the linear scale and read the distance. Then use the scale to convert the obtained map distance into the actual ground distance.
Measuring irregular (curved or bent) distances
- Division method
- Stepping method
Division method
Procedures
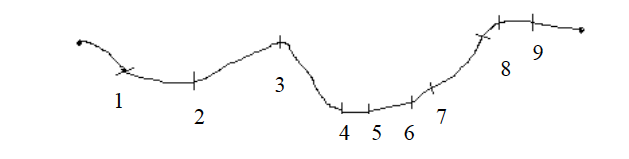
- Divide the river, road, railway, etc into many, short straight distances.
- Open your dividers and measure all distances as shown in the figure below.
- Add up the map lengths of all sections along the route.
- Use the linear scale to get the actual ground length from the sum obtained in (iii) above. The length of the route is equal to the sum of all sections, divisions or short distances.
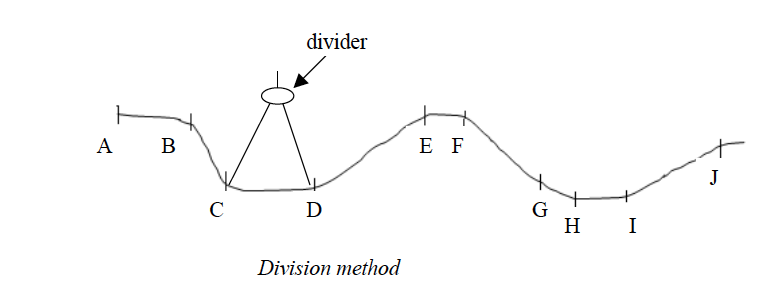
Add up all the measurements: AB = 1 km; BC = 1 km; CD = 1 km; DE = 2 km; EF = 0.5 km; FG = 2 km; GH = 0.5 km; HI= 1 km; IJ = 2 km = Total length = 10 km.
Stepping method
- Open and set the pair of dividers to a known distance by using the linear scale e.g. quarter or half a kilometre as shown in the figure below.
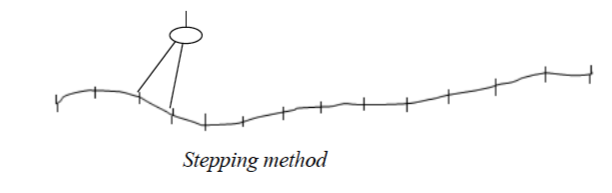
- Follow the river, road or line by stepping along it using the set dividers.
- Add up the number of steps and multiply by quarter or half a kilometre (depending on the set length).
Example 3
Suppose number of steps when the divider is opened to a quarter kilometres wide is 20 and when it is a half, kilometre is 10. Then, the length of the route is:
10 x ? = 5 or 20 x ? = 5 kilometres
Note that if the distance of the last step is less than the set distance of the dividers, measure it separately and estimate its distance on the linear scale. Add up this distance to the total distance from the steps to get the full distance of the route (river, road or line).
Areas of Regular and Irregular Figures
The figures whose areas are to be calculated on maps can either be regular or irregular
Calculating areas of irregular shapes
Features with regular shapes on maps are rectangular, triangular, square or circular. Finding the areas of such figures is simple. Mathematical formulae are used to calculate their areas. However, it is not common to find regular features on maps.
Calculating areas of different regular shapes
- Triangles = L x W, where L = length and W = width.
- Squares =L2, where L = length of the side of a square.
- Triangles = ?bh, where b = length of the base and h = length of the height.
- Circle = πr2 or πD2/4, where r = radius, D = diameter and π = 3.14 or 22/7
Calculating areas of irregular shapes: Features with irregular shapes are very common on maps. These may include shapes of lakes, forests, plantations, settlements, marshy land, etc.
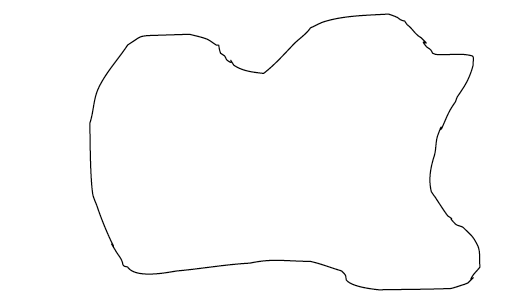
An irregular shape
There are three methods used to calculate areas of irregular shapes. These are the:
- division method;
- tracing method; and
- grid square method.
Division method
In this method, the area to be measured is divided into rectangles or squares and triangles or into several strips of the same length and width. Then, the area of each resulting figure is calculated using mathematical formula and summed up to get the total area.
- Divide the whole area into rectangles, squares or triangles.
- Calculate the areas of the rectangles, squares and triangles using mathematical formulae.
- Sum up individual areas to get the total area Remember that the area should be in the same units as the map scale.
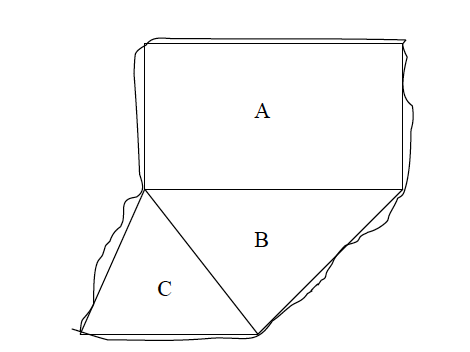
Example 4
The area above is divided into three figures A, B and C. The area of the three resulting figures is calculated as follows:
Rectangle A: Area = L x W = 10 x 5 = 50 km2
Triangle B: Area = ½bh = ½x 6 x 4 = 12 km2
Triangle C: Area = ½bh = ½x 4 x 3 = 6 km2
Total area = A + B+ C = 50 +12+6 = 68 km2
Division of the area into strips
The stripping method involves dividing the area into strips and then calculating the area of each strip separately. The total area is obtained by summing up the areas of all rectangular strips.
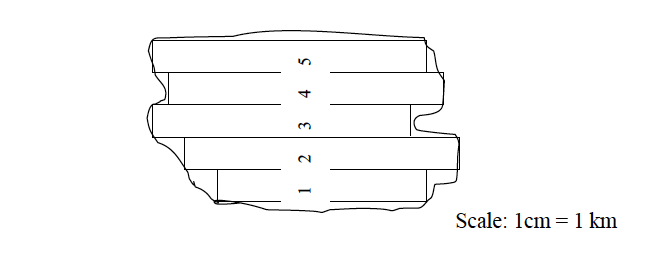
Procedures
- Divide the area into uniform rectangular strips.
- Calculate the area of each rectangular strip separately. Remember that the areas of the strips should be in the same units as the scale of the map.
- Add up the area of each strip to get the total area.
Area = sum of the areas of all individual strips = area of 1 + 2 + 3 + 4 + 5
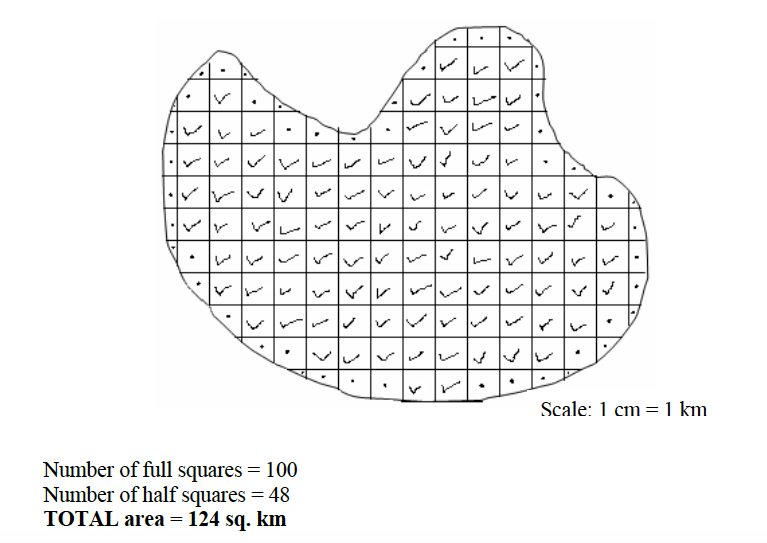
Tracing method
- Trace off the outline (boundary) of the figure to be measured onto a tracing paper (graph paper) or ordinary tracing paper and transfer the outline onto a squared paper.
- Tick and count all complete squares and sum up their areas. Remember that each full square measures 1 cm x 1 cm.
- Mark all incomplete squares with crosses.
- Count all incomplete squares and divide the sum by 2 to get the number of complete squares.
- Add up the squares in (iii) and (iv) to get the total number of squares covering the area of the figure to be estimated.
- Using the scale provided, find the area of one square in order to obtain the actual area that would be covered on the ground. Note that the area that you calculate is the approximate area.
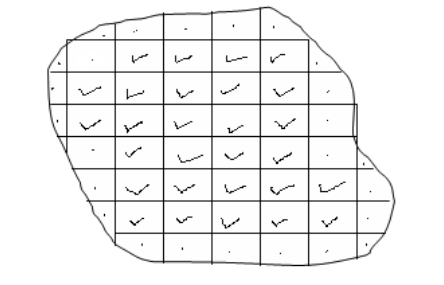
According to the figure above, the number of complete squares is 28. The number of incomplete squares is 25. To get the complete squares, we divide 25 by 2, i.e., 25 ÷ 2 =12.5
Hence the total number of complete squares = 28 +12.5 = 40.5. This is the same as 40.5 cm2.
Assume that the scale of the map is 1:50,000. Then, the area of 1cm by 1cm on the ground is 0.5 x 0.5 km = 0.25 km2
Therefore, the total actual ground area of the irregular shape is calculated thus: Area = 40.5 x 0.25 =10.125 km2.
Remember that if you don’t have the tracing paper you can draw the squares straight on the map using the following procedures:
- Mark by a pencil the margin of area to be measured.
- Using the grid reference lines as your guidelines, draw the squares with faint pencil lines across the area. If there are no grid lines make sure you draw right angled squares across the figure.
- Mark your full squares and half squares and follow the above tracing method procedures for calculating the area.
The grid square method
If the map provided has grid lines, the grid square method can be used to calculate the area on the map. The grid squares formed by the lines are used in this case. For example, in a topographical map of scale 1:50,000 the distance between two successive grid lines is 2 cm. This length is equivalent to 1 km on the ground. Therefore, every grid square on a 1:50,000 map represents 1 km2 on the ground. Consider the diagram below:
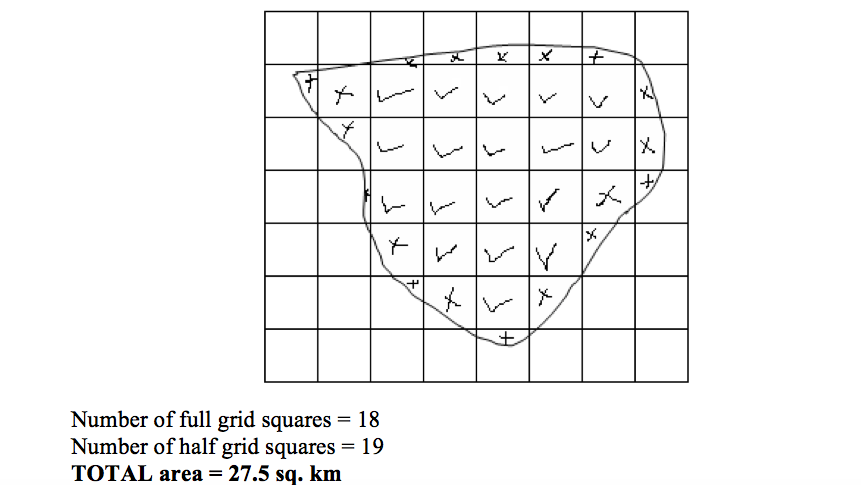
The procedures for calculating the area of a figure on a map with grid squares are similar to those used in the tracing method discussed previously in this chapter.
Location of Position
In map reading, position is a place where an object is situated on the earth’s surface. The geographic position of a place may be shown by using:
- Place names
- Compass bearing
- Latitude and longitude
- Grid reference
- Political and administrative boundaries
Use of place names
Names of places on maps may be used to locate the position of an area or place. Names of places e.g. Morogoro, Tarime, Mbeya, etc are clearly marked and shown on maps.
Compass bearing
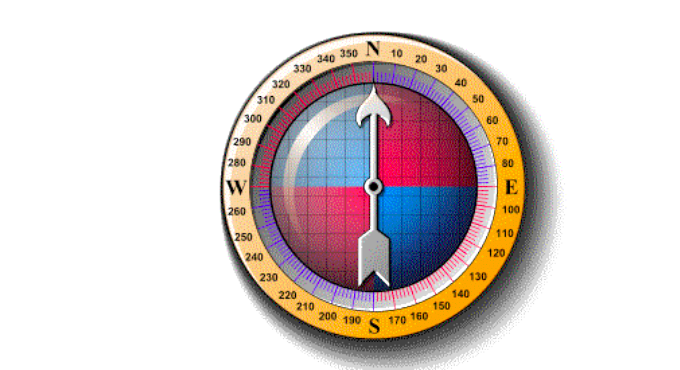
Many years ago it was discovered that a magnetized piece of iron or needle, if hung or allowed to swing freely, will always point to the same direction. This direction is called the North. It is from the north direction that we measure other directions, that is, East, West and South.
A compass is an instrument used to measure directions from the north. It consists of a free-swinging, magnetized needle which points to the north and south magnetic poles.
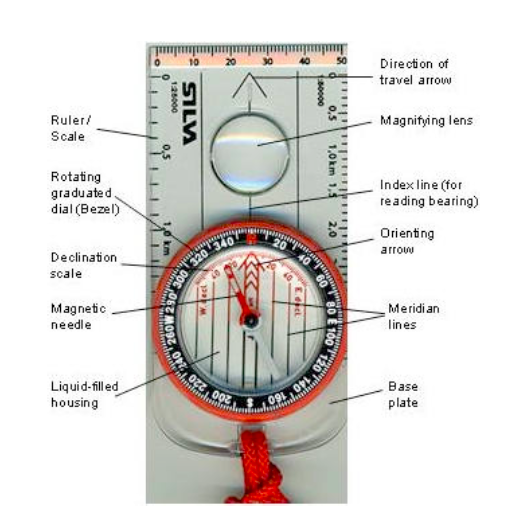
A compass
The compass can be used to show directions in the following ways:
North direction
The north direction may be shown by using; Geographic or True North; Magnetic North and Grid Nortn.
- Geographic or True North is the direction towards the North Pole from any place on the earth’s surface. It is always indicated by the north arrow. When reading directions on maps we usually use the True North.
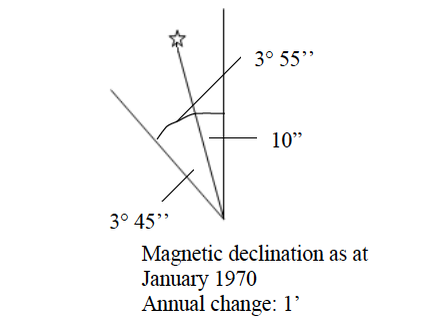
- Magnetic North is the direction to which the compass needle points. The magnetic North is some distance from the True North and also varies from year to year in relation to the True North.
- The Grid North is the direction towards the north in those maps drawn to grid system.
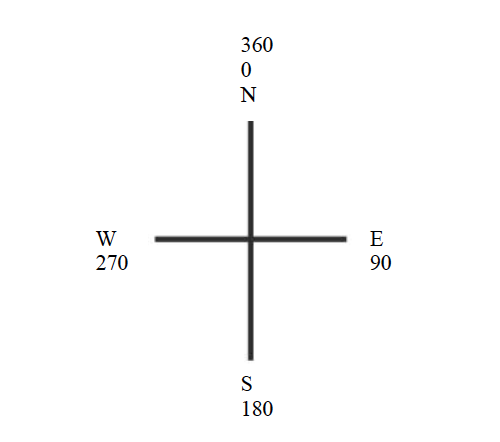
Compass directions
There are four major directions, bearings or cardinal points on maps with respect to a fixed point, be it true North or magnetic North. They are marked by 90º.
The four cardinal points can further be sub-divided into eight points of 45º
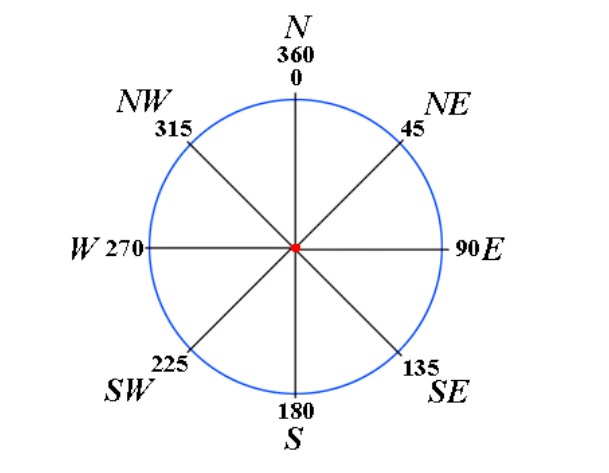
The eight points of a compass can further be sub-divided into sixteen points of 22.5º
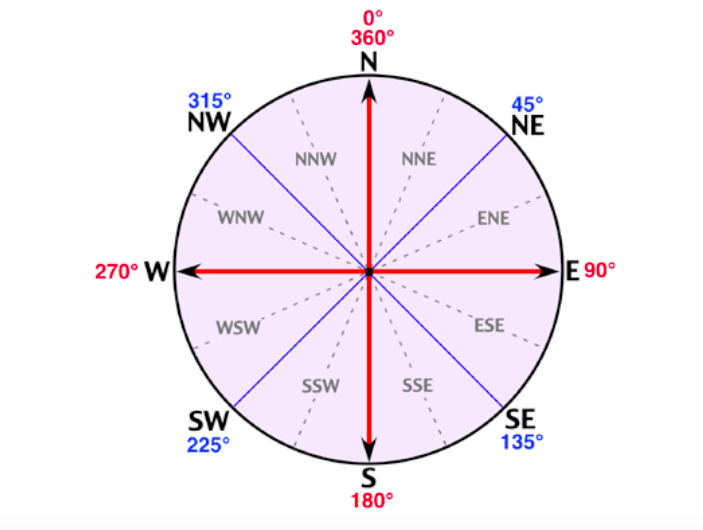
Bearings of a compass
Compass bearing shows the direction of a point with respect to another point measured clockwise from 0o to 360o. Bearing is expressed in degrees which are further sub-divided into minutes and seconds.
Bearings of a compass
Grid reference
A grid system is a pattern of horizontal and vertical lines forming squares of uniform sizes drawn on a map. Grid system is numbered East and North and is referred in terms of Easting and Northing.
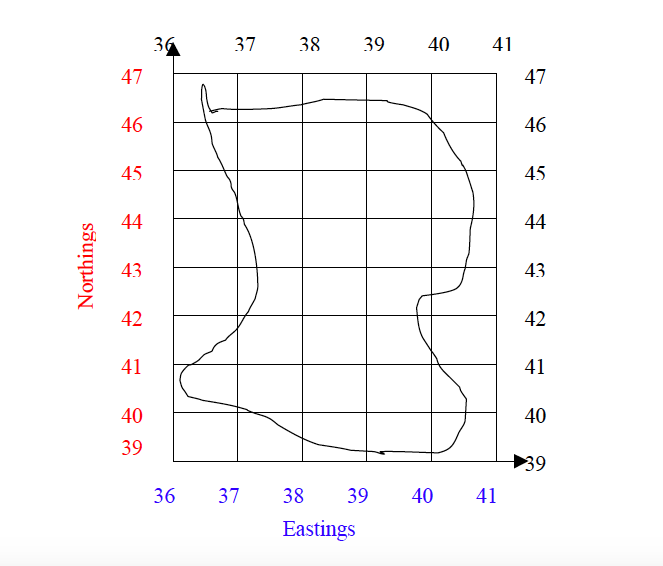
Grid lines are not lines of latitude and longitude, but are drawn to a definite distance apart, which varies according to the scale of the map and unit of measurement used in a map. The reading in a grid system is referred to as grid reference and is given in a six-figure number.
Using grid reference
- The full grid reference is given in a six-figure number.
- Easting – the eastward direction or reading are always given first.
- Northing – the northward direction or reading follows after the Easting.Example Easting = 351 Northing = 421 Full grid reference = 351421
- When a place or point falls on the main gridlines or bisected by the grid line, add 0 to each reading Example A place is bisected by:- Easting =35 Northing = 40 The grid reference of a point will be 350400
- When a place or point falls in the middle of a grid square, the grid square is sub-divided into ten equal squares or tenths. The grid reading or direction is given to the nearest tenths. Consider the point, A, in the figure below). Example See point B in the figure below. The point lies between the following grid reference: Easting = 35 Northing = 42
Procedures
- Divide the grid square into tenth to locate the point or place. For example, point A in the figure below lies at:- Easting = 5 tenths Northing = 5 tenths
- Read the easting adding the 5 tenth digit = 565
- Read the nothing adding the 5 tenth digit =225
- Full grid reference of the point is 565225
Direction and Bearing of Object on Maps
The bearing of a lace on a map can be found when the north is given. The North is usually an arrow sign pointing to the north.
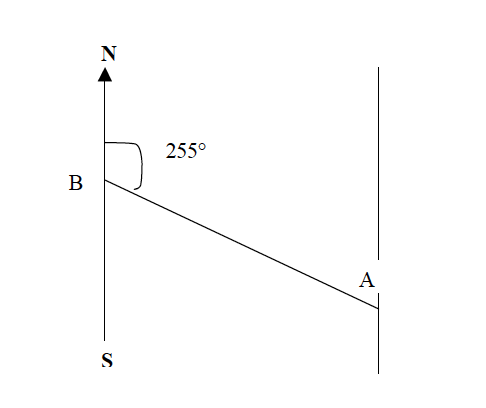
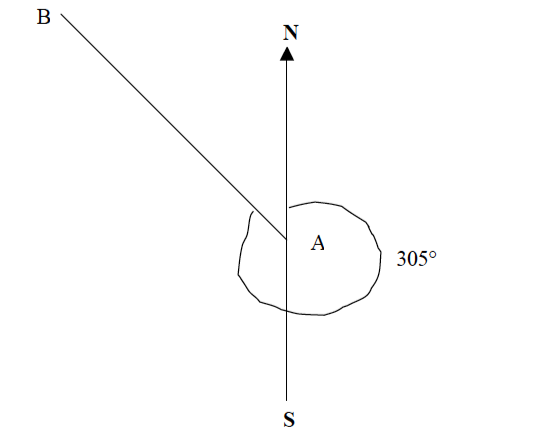
Example 5
Find the bearing of point B from point A.
Procedures
- Join points B and A with a straight line.
- At point A, draw a line parallel to the north-south line.
- Using a protractor, measure the angle B from the north towards line BA as shown below.
Direction of a place
The direction of a place or point is its direction with respect to another point measured by using the points of the compass e.g. North, South, East and West.
Example 6
Find the direction of point B from point A.
Procedures
- Join points A and B with a straight line.
- At point A, draw a line parallel to the north-south line or compass direction sign that is given on a map.
- Draw a horizontal line at point A to get the East and West of the four points of the compass.
- Find the direction of point B from A to the nearest point of the compass. The four, eight or sixteen points of a compass may be used.
When finding angular bearing or direction of a compass, always use the “True North” which is given on the map.
Methods Used to Show or Locate Positions of a Place on a Map
The following are major methods used to show positions of a place on a map.
1. Grid reference
2. Place name
3. Bearing and compass direction.
4. Latitude and longitude.
1. Grid Reference
Grid reference is a network of vertical lines and horizontal lines on a map. Vertical lines whose numbers increases towards the east are called easting. Horizontal lines whose numbers increase towards the north is known as Northings. Where horizontal lines and vertical lines meet or cross each other they form a square known as grid square. A grid reference point is written inform of six digits starting with three digits of Eastings then three digits of Nothings.
A = 343086 B = 333036 C = 383077 D = 397046
NB: To write numbers of grid reference starts with easting then northing.
2. Place Name. You can locate the position of a place by where the features are found i.e. Kigoma, Mbeya, Dodoma, Lindi etc.
3. Compass Bearing and Direction
How to find direction of a place on map. Identify them due to points on the given map. Points may be given by using grid reference points, place name or letter. Draw a straight line connecting the two points Mark the major four cardinal points at the starting point with the word from.
How to Find Bearing on the Map
1. Identify the grid reference points given on the maps.
2. Draw a straight line connecting the two points
3. Draw the major four cardinal lines at the starting
4. Use a protector to measure degree clockwise from north up to the line joining the two points.
5. Then Provide your answer in degrees
BEARING
In bearing there is;
a) Forward bearing
b) Backward bearing
a) Forward Bearing Is a bearing into a subject.
Procedures to calculate forward bearing
1. Identify the two points.
2. Join them with a straight lines
3. Draw north direction on a second point.
4. Measure the angle by using a protector.
5. State the bearing in terms of degrees of the direction.
b) Backward Bearing. Is the opposite of forward bearing, it’s taken from the object to the observer while forward bearing is taken from observer to the object.
How to determine the back bearing:
1. Find forward bearing.
2. Mark the cardinal point north direction of the opposite point
3. Find the bearing of the observer along the straight line principally to determine the back bearing
BB= FB +1800 if FB < 180°
BB= FB -1800 if FB >180°
For example:
The forward bearing (FB) of Tukuyu from Kyela is 45° , Back bearing (BB) will be;
BB = FB + or – 180°. BB = 45° +180° (FB added because it’s not greater than 180) Therefore Back bearing is 225°
Importance of the Use of Maps
1. People use them to reach their directions
2. Maps are used to describe the features of the earth
3. Builders use maps to plan the best use of the land
4. Road constructors use maps to construct new roads
5. Maps are useful in military activities
6. Maps are used in conducting various geographical researches
7. Maps are used to record and store information about the environment, the location of natural resources, capital assets and people. This is because the features change while map information does not change. As such, maps store information for future reference.

EmoticonEmoticon